Scenario Comparison Dashboards
Enable data-driven discussions
All stakeholders can immediately see the impact of the different scenarios from multiple perspectives and collaboratively work on a plan that is achievable, that everyone is confident in and that everyone is committed to deliver.
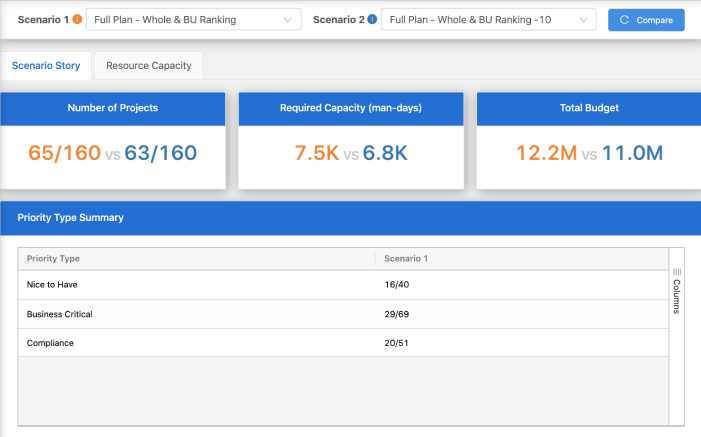
Multi-dimensional comparison
Compare 2 scenarios from multiple viewpoints, e.g. priorities, objectives, business units, resource impact, delivery timelines, etc.
Categorise your projects and summary tables show the effect on your portfolio scenario across those multiple categories.
Multi-dimensional comparison
Compare 2 scenarios from multiple viewpoints, e.g. priorities, objectives, business units, resource impact, delivery timelines, etc.
Categorise your projects and summary tables show the effect on your portfolio scenario across those multiple categories.
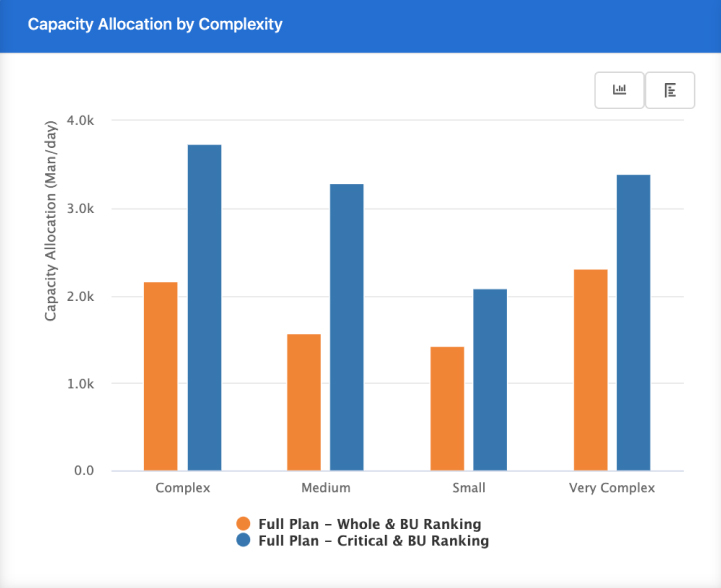
Graphical Charts
Powerful charts graphically highlight the key differences between scenarios, promoting discussion and joint understanding.
Graphical Charts
Powerful charts graphically highlight the key differences between scenarios, promoting discussion and joint understanding.
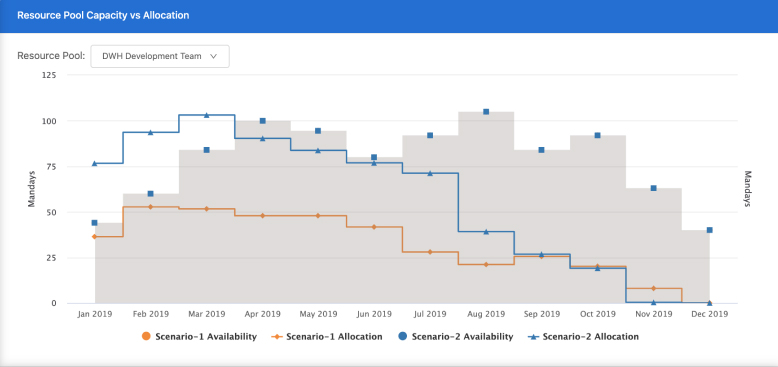
Understand impact of the scenario
on particular critical team
Explore the scenario through the lenses of a critical team, balancing its workload over time, predicting challenges to overcome.
Understand impact of the scenario
on particular critical team
Explore the scenario through the lenses of a critical team, balancing its workload over time, predicting challenges to overcome.